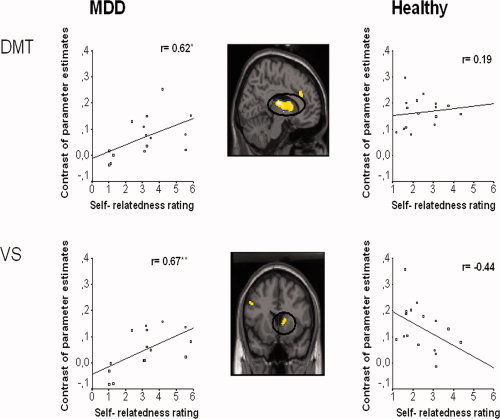
Figure 3.

Correlation of postscanning subjective ratings for self‐relatedness in negative emotional pictures with BOLD signals obtained in the contrast PJ > PV in healthy and subjects with MDD. SPM images shows statistical parametric (T) maps for the comparison between healthy subjects and patients with MDD, overlaid on a single subject's normalized brain in the MNI stereotactic space (P < 0.001; uncorrected; k > 5) during PJ > PV. The saggital view represents the left hemisphere. The scatter plots show subjects' self‐relatedness ratings for negative pictures on x‐axis and % signal change in left DMT (−10, −14, 10) and VS (10, 10, 6) during PJ > PV on y‐axis. Scatter plots are presented for both healthy and depressed subjects (**P < 0.01; *P < 0.05). DMT, dorsomedial thalamus; VS, ventral striatum; MDD, major depressive disorder. [Color figure can be viewed in the online issue, which is available at www.interscience.wiley.com.]
