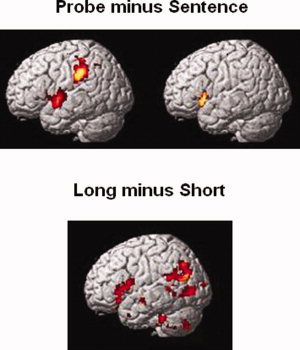
Figure 3.

Activation maps. The top figure depicts the probe minus sentence contrast for conjoined‐active sentences (left) and object‐relative sentences (right). The bottom figure depicts the resulting activation from the long minus short contrast for conjoined‐active sentences. There were no regions showing differential activation as a function of distance for the object‐relative sentences (for either the long minus short or the short minus long contrast).
