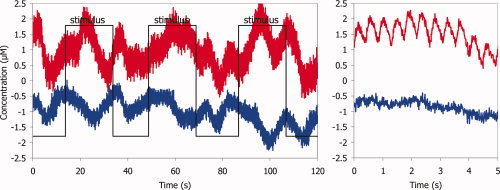
Figure 2.

Example of (unprocessed) NIRS signals from infant 7: left side: concentration changes of O2Hb (upper trace) and HHb (lower trace). The square wave indicates when the visual stimulation is on. On the right side: extended time scale with visualisation of pulse wave in O2Hb. [Color figure can be viewed in the online issue, which is available at www.interscience.wiley.com.]
