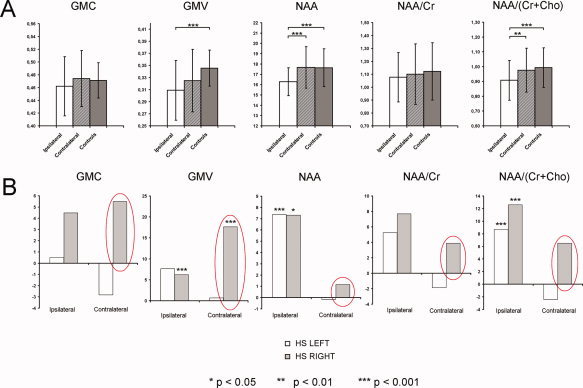
Figure 3.

A: Comparisons of analyzed data from the ipsilateral, contralateral, and healthy thalami (complete group data); B: Relative differences between values of analyzed variables in patients and healthy controls, separately for the subgroups of patients with left‐ and right‐sided HS pathology.
