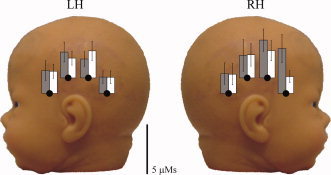
Figure 4.

The HbT AUCs for speech (gray) and music (white) responses averaged over the subjects with significant (P < 0.02) positive responses (eight subjects). Values are shown for only the long SDD. The errorbars indicate the standard deviations. [Color figure can be viewed in the online issue, which is available at www.interscience.wiley.com.]
