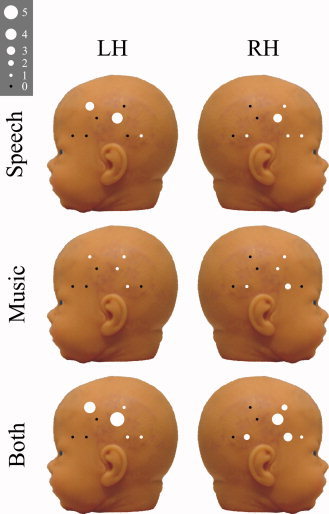
Figure 5.

Variations in the locations of maximal significant HbT AUCs over all neonates for each detector location on both hemispheres for each stimulus condition separately and both conditions summed. The diameter of the marker indicates number of maximal responses at that measurement site. [Color figure can be viewed in the online issue, which is available at www.interscience.wiley.com.]
