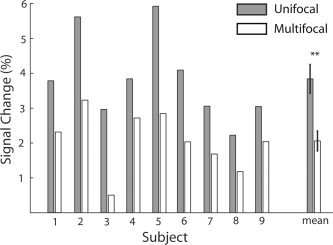
Figure 3.

Percent signal change in BOLD response for the central region (Region 5) of the stimulus measured from V1 in Experiment 1. Gray bars correspond to the unifocal condition, with only the central region of the stimulus modulated. White bars correspond to the multifocal condition, with all the nine regions modulated independently. Data from all nine subjects is shown. The mean shows the same data pooled across subjects, error bars correspond to the standard error of the mean (SEM). Asterisks indicate statistically significant (P < 0.01) differences in BOLD signal change.
