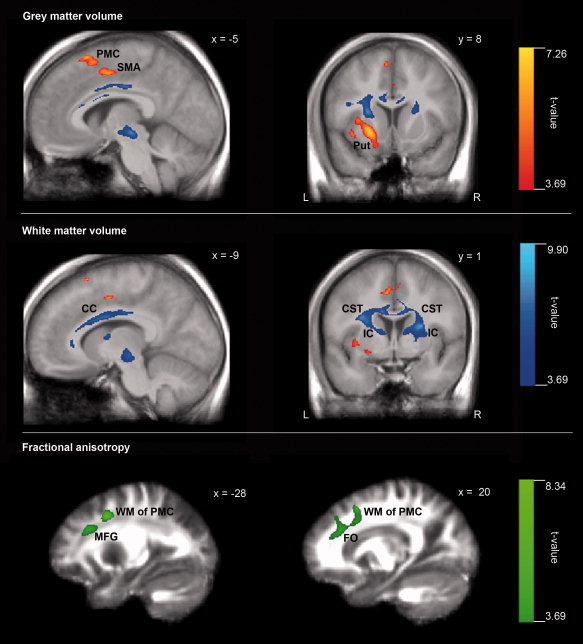
Figure 1.

Local structural brain differences between professional female ballet dancers and control females. Decreased gray matter (GM) volume in ballet dancers are shown in red, decreased white matter (WM) volume in blue, and decreased fractional anisotropy (FA) in green. Statistical parametric maps were height‐thresholded with P = 0.001 (uncorrected) and cluster extent familywise error (FWE) corrected with P = 0.01. Additionally, clusters were corrected for nonstationarity of smoothness. Note that the size of the spots in Figure 1 deviates from the cluster size reported in Table II. This difference results from the nonstationary smoothness correction that is only implemented for the number (list) of clusters yet. The correction of the statistical image, that is, the maximum intensity projection itself, is not still possible due to technical problems in its implementation; hence the uncorrected cluster sizes are shown in the figure. L, left; R, right; x,y, x‐ and y‐coordinate in Montreal Neurological Institute (MNI) space.
