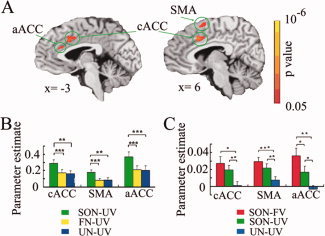
Figure 2.

fMRI results in healthy subjects. (A) Brain activations during SON‐UV compared to FN‐UV (P = 0.01, FWE corrected). (B) Parameter estimates (means ± S.E.) for SON‐UV, FN‐UV, and UN‐UV in the cACC, SMA, and aACC in the event‐related experiment (Experiment 1). (C) Parameter estimates (means ± S.E.) for SON‐FV, SON‐UV, and UN‐UV in the same three ROIs for the block‐design experiment (Experiment 2). * denotes P < 0.05; ** denotes P < 0.01; *** denotes P < 0.001.
