
Figure 3.
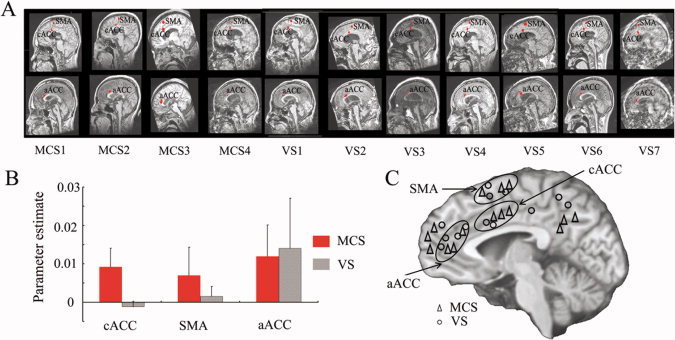
Patient fMRI results. (A) ROIs defined for cACC, SMA, and aACC in the patients with DOC. (B) Parameter estimates for the VS and MCS patients respectively in the three ROIs (mean ± S.E.). (C) Schematic representation of the midline structures activated during SON‐FV in the patients. Those activated areas (labeled with points) in the same circle were regarded as the activations in the same anatomical localization.