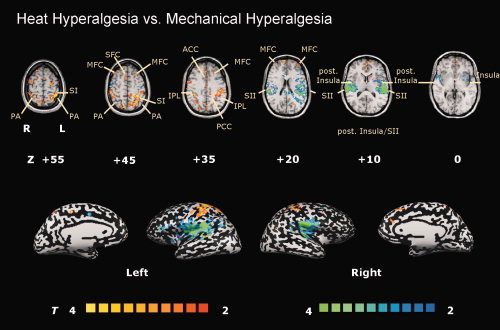
Figure 3.

The T‐statistic contrast map compares the conditions “heat hyperalgesia” vs. “mechanical hyperalgesia”. Areas activated more during heat hyperalgesia are coded in red/yellow, those more activated by mechanical hyperalgesia are coded in blue/green. The group statistic contrast maps are registered onto a Talairach‐transformed brain, thresholded at T > 2, P < 0.05 uncorrected for multiple comparisons and a cluster threshold of 300 voxels. Activations seen in the left hemisphere are contralateral to the stimulation side. The Talairach‐coordinates, T‐scores, Bonferroni‐corrected P values and cluster sizes are depicted in Table I. Abbreviations: ACC, anterior cingulate cortex; PCC, posterior cingulate cortex; TH, thalamus; SFC, superior frontal cortex; MFC, middle frontal cortex; IFC, inferior frontal cortex; S1, primary somatosensory cortex; S2, secondary somatosensory cortex; PA, parietal association cortex; IPL, inferior parietal lobule.
