
Figure 4.
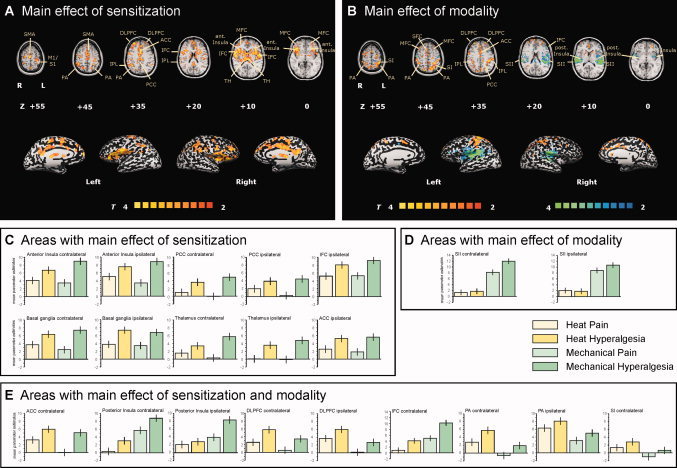
Main effects of the factors “sensitization” and “modality”. The T‐statistic contrast maps show (A) the main effect of sensitization, averaged across both modalities, and (B) the main effect of modality, averaged across both sensitization states. Areas that are coded red/yellow in (A) showed a significantly greater response during the sensitized state compared with the nonsensitized state. Areas that are coded in red/yellow in (B) showed a significantly greater response to heat stimuli than to mechanical stimuli. Areas that are coded in blue/green in (B) showed a significantly greater response to mechanical stimuli than to heat stimuli. The group statistic contrast maps are registered onto a Talairach‐transformed brain, thresholded at T > 2, P < 0.05 uncorrected for multiple comparisons and a cluster threshold of 300 voxels. Activations seen in the left hemisphere are contralateral to the stimulation side. The Talairach‐coordinates, T‐scores, Bonferroni‐corrected P values and cluster sizes are depicted in Table I. Abbreviations: ACC, anterior cingulate cortex; PCC, posterior cingulate cortex; TH, thalamus; SFC, superior frontal cortex; MFC, middle frontal cortex; IFC, inferior frontal cortex; S1, primary somatosensory cortex; S2, secondary somatosensory cortex; PA, parietal association cortex. The mean parameter estimates (beta values) for each condition in (C) areas with a main effect of sensitization, (D) areas with a main effect of modality, and (E) areas with a main effect of sensitization and modality are shown. Error bars indicate SEM.