
Figure 5.
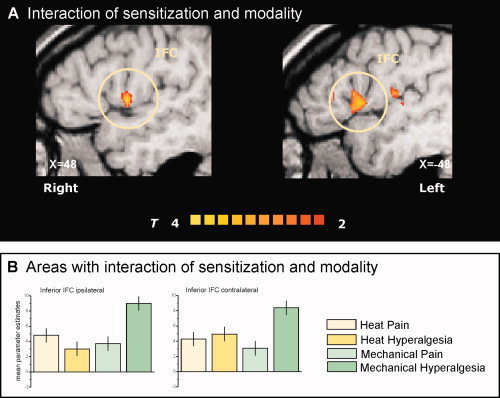
Interaction contrast. The (A) T‐statistic contrast map shows interaction of the factors “sensitization” and “modality” only located bilaterally at the caudal part of inferior frontal cortex (IFC). The (B) mean parameter estimates of the four conditions reveal the nature of sensitization–modality interaction: only mechanical stimuli on sensitized skin lead to increased activation in this subregion of the IFC. The group statistic contrast maps are registered onto a Talairach‐transformed brain, thresholded at T > 2, P < 0.05 uncorrected for multiple comparisons and a cluster threshold of 300 voxels. Activations seen in the left hemisphere are contralateral to the stimulation side. The Talairach‐coordinates and cluster sizes are depicted in Table I.