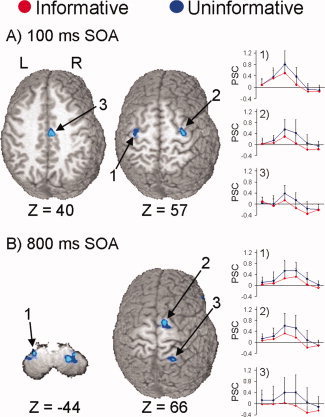
Figure 3.

Selected regions that showed a main effect of condition at the 100 (Panel A) and 800 ms (Panel B) stimulus onset asynchronies (SOA). Panel A displays two slices corresponding to 40 and 57 mm superior (Z direction) to the origin of Talairach space. Preferential activation for uninformative cues is displayed in blue coloring and informative cues in red coloring. Key areas of activation include the (1) left precentral gyrus, (2) right superior frontal and precentral gyrus, and (3) the right supplementary motor area extending to the cingulate cortex. To the right of these brain slices, the graphs display the impulse response function for selected regions based on the first six images post stimulus onset (x‐axis, time; y‐axis, mean percent signal change) for both the conditions. Panel B (800 ms SOA) corresponds to slices −44 and 66 mm in Talairach space, and includes the (1) left cerebellar tonsil, (2) right SMA and superior frontal gyrus, and (3) right superior parietal lobule.
