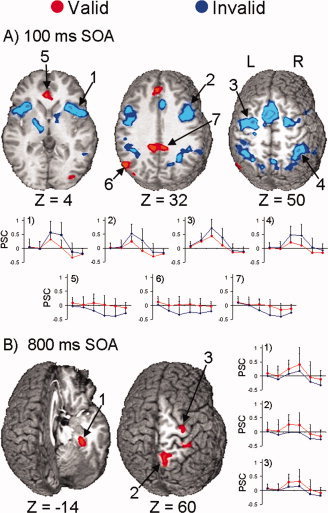
Figure 4.

Selected regions that showed a main effect of cue validity at the 100 (Panel A) or 800 (Panel B) ms stimulus‐onset asynchrony (SOA). Both panels show select foci that exhibited greater activation in response to valid (red colorings) or invalid trials (blue colorings). Panel A (100 ms SOA) displays three slices corresponding to 4, 32, and 50 mm superior (Z direction) to the origin of Talairach space. The impulse response functions (x‐axis, time; y‐axis, mean percent signal change) for the (1) right insula, (2) right inferior and middle frontal gyrus, (3) left FEF, and (4) right posterior parietal lobe are presented, all of which showed greater activation for invalid than valid trials. The next three graphs show the percent signal change in the (5) bilateral anterior cingulate gyrus, (6) left middle temporal and angular gyrus, and (7) bilateral posterior cingulate gyrus, which showed greater activation for valid than invalid trials due to deactivation during the invalid trials. Panel B (800 ms SOA) shows two slices corresponding to −14 and 60 mm superior to the origin of Talairach space, and includes activation within the (1) right parahippocampal and fusiform gyrus, (2) right precuneus, and (3) right prefrontal gyrus. The graphs to the right show that activation was greater for validly than invalidly cued trials in these regions.
