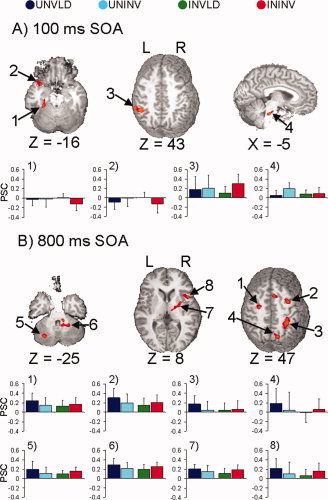
Figure 5.

Selected regions that were dependent on both cue type and cue validity for the 100 ms (Panel A) and 800 ms (Panel B) stimulus‐onset asynchronies (SOA). In both panels, impulse response functions are graphed (x‐axis, time; y‐axis, percent signal change) for valid and invalid uninformative (UNVLD, dark blue; UNINV, cyan) and informative (INVLD, green; ININV, red) conditions. Panel A (100 ms SOA) displays two slices −16 and 43 mm superior (Z direction) and one slice −5 mm to the right of the origin in Talairach space. The graphs in Panel A show the activation patterns in the (1) left parahippocampal and fusiform gyrus, (2) anterior aspects of the left superior temporal gyrus, (3) left IPL, and (4) bilateral pons amongst the four conditions. Panel B (800 ms SOA) corresponds to slices −25, 8, and 47 mm superior to the origin. The first row of graphs display activation patterns in the four conditions that were preferentially associated with IOR, including the left and right precentral and middle frontal gyrus (Graphs 1 and 2), the right inferior parietal lobe (Graph 3), and the right precuneus (Graph 4). The last row of graphs display activation patterns in regions that modulated both modes of control, but exhibited opposite patterns of cue‐validity effects, including the left cerebellar tonsil and right culmen (Graphs 5 and 6) and the right insula (Graph 7). Data from the right putamen (Graph 8) is also displayed.
