
Figure 1.
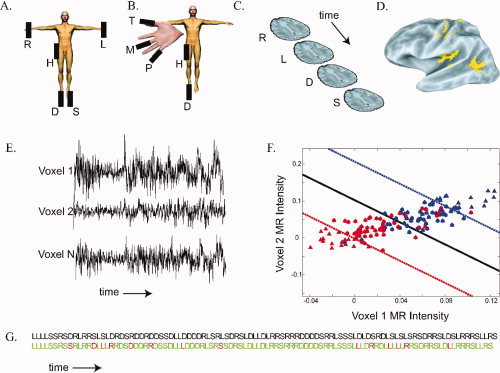
Methods used for somatosensory multivoxel pattern analysis. A. Somatosensory stimuli were delivered by five piezoelectric benders. In experiment 1, the benders were located on the palm of the right hand (R), the palm of the left hand (L), the sole of the right foot (D), the sole of the left foot (S), and the right hip (H). B. In experiment 2, the benders were located on the right thumb (T), the right middle finger (M), the right fifth pinky finger (P), the right hip (H), and the right foot (D). C. During the course of an MRI scan series, brain volumes were acquired (shown schematically by single brain slices) every 2 sec. Each acquisition corresponded to a single stimulation trial in which a single body site was stimulated, shown by a letter corresponding to the body plan shown in (A). Some trials (not shown) contained target bender stimulation or fixation baseline with no somatosensory stimulation. D. Using the MR data, an activation map was constructed of voxels responding significantly more (P < 10−6) to somatosensory stimulation than to fixation baseline. A lateral view of a partially inflated left hemisphere is shown, yellow color shows active areas (Argall et al.,2006). E. Over the course of a scan series, 150 brain volumes were acquired. The three black traces show the image intensity over the course of a scan series in three active voxels selected from the yellow voxels in (C). F. The time series from all active voxels (E) and the stimulus ordering (C) were used to train an N‐dimensional support vector machine. For illustration, a simplified training dataset is shown, with only two voxels and two stimulus categories (right hand and left hand). Each symbol shows the normalized MR image intensity during a single trial. The red triangles show the MR image intensity in all right hand stimulation trials and the blue triangles show the intensity in all left hand stimulation trials. The solid line shows the separating hyperplane W T X i + w 0 = 0 calculated by the classifier. The dashed lines show the margin boundaries W T X i + w 0 = ±1. Trials falling between the margin boundaries were used as support vectors (indicated by circles). An unknown test trial is classified as “right hand” if it falls below the solid line and “left hand” if it lies above the solid line. G. Result of the experiment 1 classifier when tested on a different scan series not used for training. The actual stimulus ordering presented to the subject is shown in the top row in all black, body part abbreviations as in (A). The classifier prediction of the stimulus ordering is shown in the bottom row: green for correct classification, red for incorrect classification. Performance of the classifier in this scan series was 86% correct (P < 10−38). [Color figure can be viewed in the online issue, which is available at www.interscience.wiley.com.]