
Figure 4.
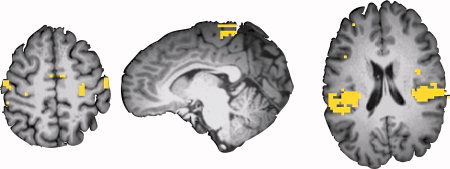
Support vector weight maps. Map of the support vector weights (|weights|>10 colored yellow) assigned to each voxel in an ROI‐free analysis, for the same subject as shown in Figure 2. Note the high weights for voxels in S1 (left), S1foot (middle), and S2 (right). [Color figure can be viewed in the online issue, which is available at www.interscience.wiley.com.]