
Figure 1.
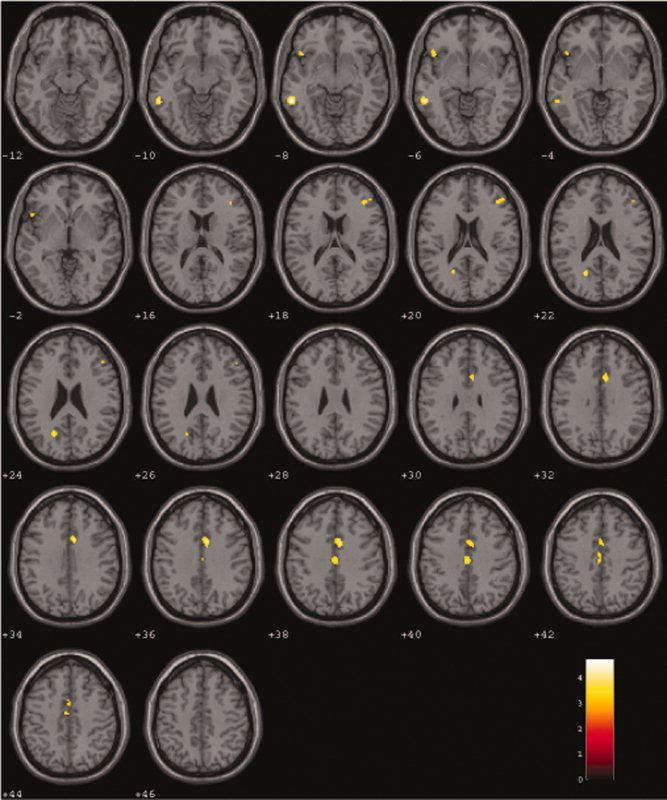
Regression analysis of BOLD response (NRG1 C/C < T/C < T/T) during semantic verbal fluency (SVF) versus reading. During semantic verbal fluency versus reading BOLD response increased with the number of T‐alleles in a linear fashion (P < 0.001, corrected by Monte Carlo simulations; cluster extend = 26 voxels). Numbers on colored bar represent t‐values.