
Figure 5.
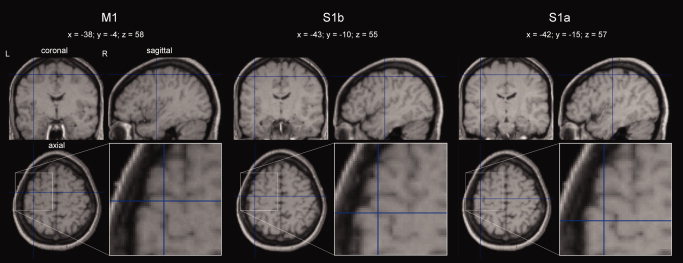
Mean positions across subjects of the three M1, S1b, and S1a FSs, after normalization of individual data in the MNI space (for the procedure, see the legend of Table I). The magnification of the source position in the axial view is shown in the corresponding inset, where the topographical relationship with ω‐shaped Rolandic sulcus tract is clearly identifiable. [Color figure can be viewed in the online issue, which is available at www.interscience.wiley.com.]