
Figure A1.
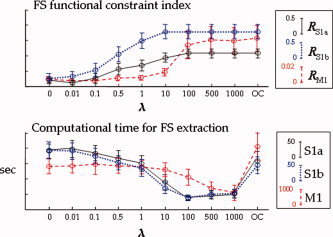
Mean and standard errors across subjects for the tested λ‐values of the RS1a (solid line), RS1b (dotted line), and RM1 (dashed line) indices (top), and of the computational times for the three source extractions (bottom)r. [Color figure can be viewed in the online issue, which is available at www.interscience.wiley.com.]