
Figure 1.
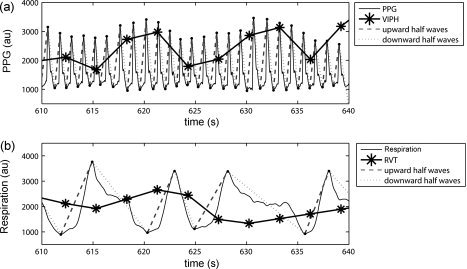
(a) shows 40 s of the recorded photoplethysmogram (PPG) of a healthy volunteer (Subject 9) measured in arbitrary units (au) and divided into downward and upward half waves (red and green lines). The normalized variation in pulse height (VIPH) is depicted by the black line. (b) shows the corresponding part of the respiratory signal, also divided into upward and downward half waves. The black line represents the normalized RVT regressor.