
Figure 2.
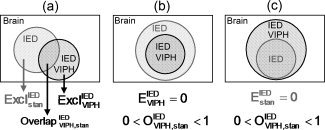
A graphical representation of the comparison of two models. In this example the correlation between IED and fMRI signals without (frac) and with VIPH (frac) correction is schematically shown. (a) shows the definitions of the areas which were calculated. (b) shows the situation in which the model with VIPH correction is a subset of the model without VIPH correction. (c) shows the reverse situation in which the model without VIPH correction is a subset of the model with VIPH correction.