
Figure 7.
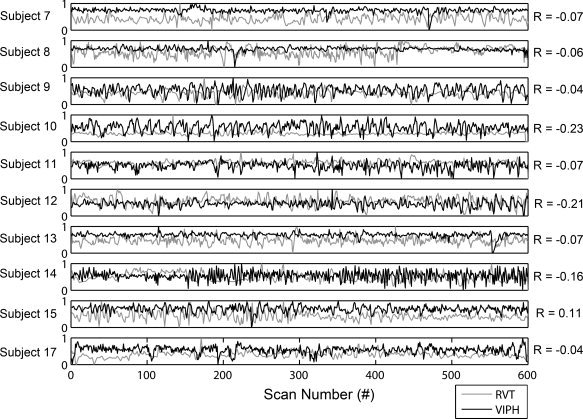
This figure shows the normalized time courses of VIPH and RVT for the healthy volunteers for whom both regressors could be accurately estimated. VIPH regressors are depicted in black as a function of scan number, whereas RVT regressors are depicted in grey.