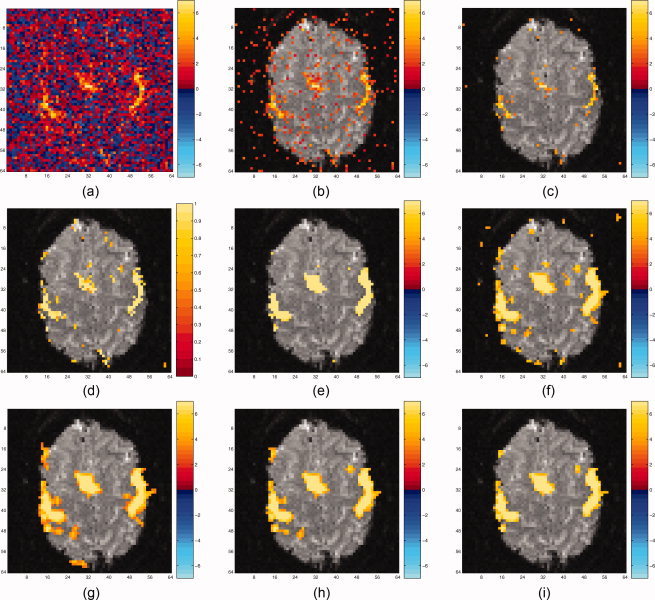
Figure 5.

Various thresholding procedures applied to real dataset. (a) shows the unthresholded raw t‐statistics, (b) and (c) show two thresholding procedures applied to the raw t‐statistics (b, fixed threshold of 1.645; c, BH procedure), (d) shows the posterior probabilities from the spatial mixture model thresholded at 0.5, (e) and (f) show two thresholding procedures applied to the t‐statistics smoothed with a 2 voxel FWHM Gaussian kernel (e, Bonferroni with smoothing; f, BH with smoothing), while (g)‐(i) show several cluster size thresholding procedures with var ying u and cluster error rate of 5%, applied to the smoothed t‐statis‐tics. (g) Cluster size threshold, u = 2.0; (h) Cluster size thresh‐old, u = 2.5; (i) Cluster size threshold, u = 3.0.
