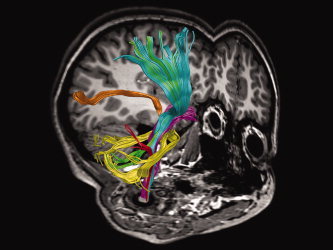
Figure 2.

Sensory and motor tracts used in the study. Tracts were reconstructed and displayed on a 3D T1‐image for a typical control subject: Corticospinal tract (cyan), inferior cerebellar peduncle (red), middle cerebellar peduncle (yellow), medial lemniscus (magenta), posterior thalamic radiation (orange), and superior cerebellar peduncle (green). [Color figure can be viewed in the online issue, which is available at www.interscience.wiley.com.]
