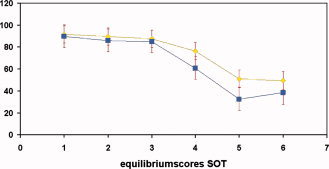
Figure 4.

Graph depicting the significant interaction effect between sensory condition and group. The TBI group performed significantly worse than the controls on condition 5 (eyes closed, sway referenced surface). [Color figure can be viewed in the online issue, which is available at www.interscience.wiley.com.]
