
Figure 2.
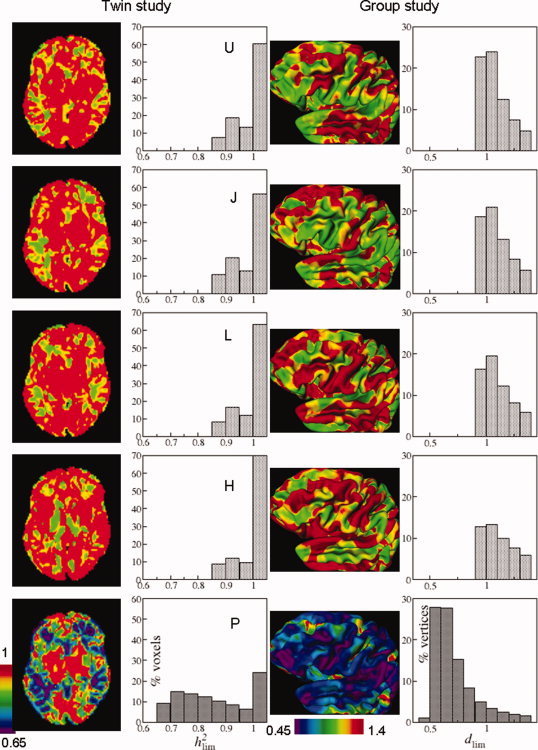
Transverse slices of the model brain showing the lowest detectable effect size h for the single sites (from top downward, U0, J, L, H), and the 4‐site multicenter pool (bottom, P) (left column; see Fig. 6 for this slice's anatomy). Distributions of voxelwise lowest detectable heritabilities for the whole cerebrum (second column). View of the left hemisphere of the cerebrum with vertexwise lowest detectable effect sizes (d lim) (third column). Distributions of vertexwise lowest detectable effect sizes for the whole cerebral cortex (right column). Calculations were done with z αβ = 3.939 (twin; one‐sided) and 4.132 (group; two‐sided), and n j = 40 for all sites.