
Figure 3.
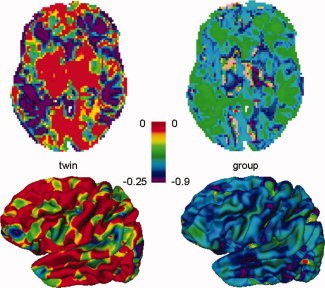
Top row: Transverse slice of the brain showing gain in lowest detectable heritability h (twin study) of the 4‐pool versus the average single site (left), and gain in lowest detectable effect size d lim (group study, right). Negative values reflect a gain in sensitivity when pooling data from the four sites. Bottom row: Lateral view of left cerebral hemisphere showing gain in lowest detectable h (left) and gain in lowest detectable effect size d lim (right).