
Figure 5.
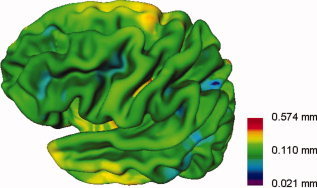
View of the left cerebral cortex showing lowest detectable thickness differences between two groups (patients and control subjects) for the multicenter 4‐pool. A logarithmic color scale is used.
Official websites use .gov
A
.gov website belongs to an official
government organization in the United States.
Secure .gov websites use HTTPS
A lock (
) or https:// means you've safely
connected to the .gov website. Share sensitive
information only on official, secure websites.
View of the left cerebral cortex showing lowest detectable thickness differences between two groups (patients and control subjects) for the multicenter 4‐pool. A logarithmic color scale is used.