
Figure 7.
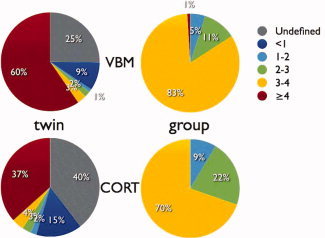
Pie charts displaying the distribution of gain factors N eff(pool)/N eff (single site) (% voxels or vertices), for VBM (top row) and CORT (bottom row); twin (left column) and group (right column) studies. Gain factors are calculated voxel‐/vertexwise with respect to the average of the single sites. Undefined: all single site N effs were zero (gray). Note that for heritability (twin) studies gain factors larger than 4 are possible. For group studies, this percentage refers to a gain factor of exactly 4 (red).