
Figure 2.
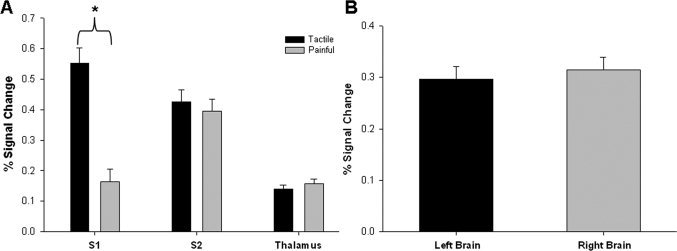
Strength of tactile‐ and pain‐evoked activations (unthresholded method). (A) The mean (±SE) % signal change within each predefined ROI is displayed for tactile and painful stimulation. The 3‐way ANOVA detected a significant interaction between brain region and stimulation type. The asterisk indicates greater percent signal change in the contralateral S1 during tactile stimulation than painful stimulation (post hoc testing: P < 0.001; t = 5.94). No difference was detected for contralateral S2 or thalamus (P > 0.05). (B) Mean (± SE) % signal change is displayed for left and right brain regions; there was no significant effect of side. (S1, primary somatosensory cortex; S2, secondary somatosensory cortex).