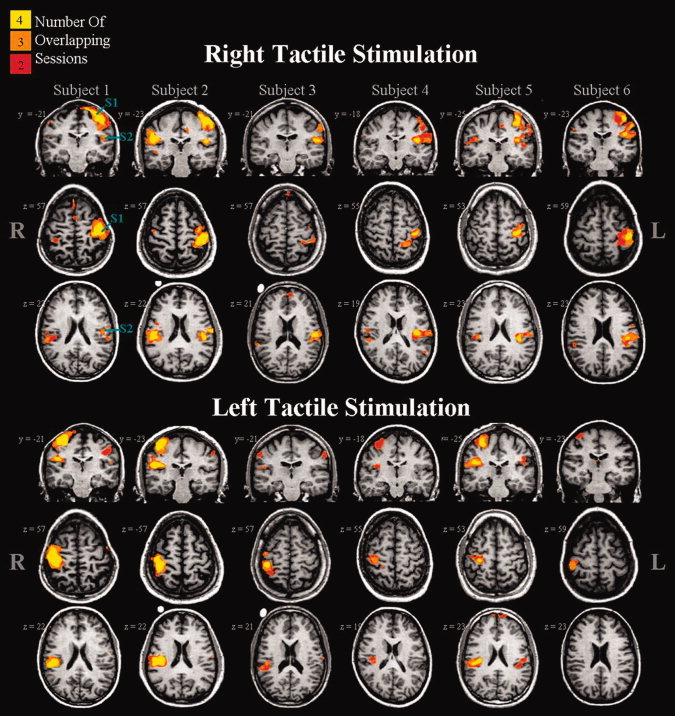
Figure 3.

Count maps of tactile‐evoked activations shown for each of the six subjects. Each column represents one subject. Stimuli were applied to the dorsal aspect of the right (top panel) or left (bottom panel) hand. Individual subject and session maps were thresholded at a corrected P = 0.05. The colour code (yellow, orange, red) is used to designate those voxels activated in four, three or two sessions. Brain regions active in only one session are not shown.
