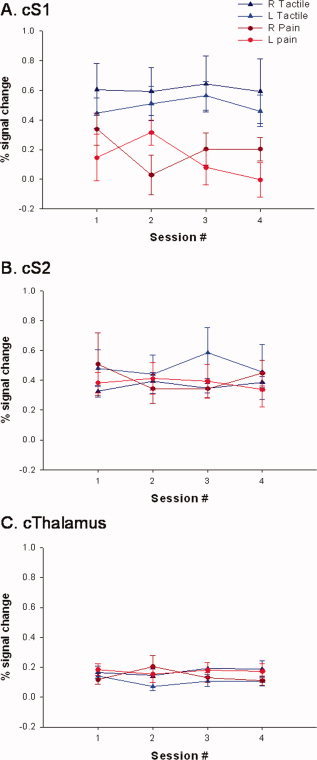
Figure 6.

Effect of time on % signal change within contralateral, positively activated brain regions. Mean (± SE) percent signal change across sessions 1–4 within contralateral S1 (A), S2 (B), and thalamus (C). Each graph displays the bi‐weekly averages for right and left, tactile and painful stimulation.
