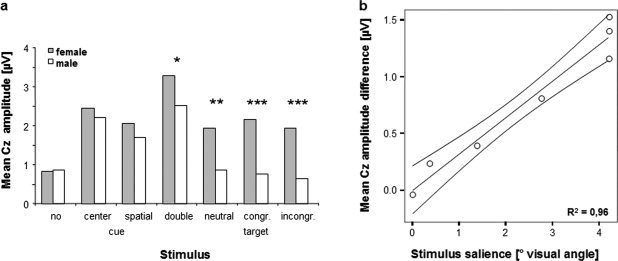
Figure 4.

(a) Mean central ERP component amplitude differences between sexes for different stimuli; * < 0.1; ** < 0.05; *** < 0.01 (b) Stimulus salience (visual angle plus vertical angle from fixation) is plotted against mean central component amplitude difference (4 cues, 3 targets; female minus male); regression line with 95% mean prediction interval.
