
Figure 4.
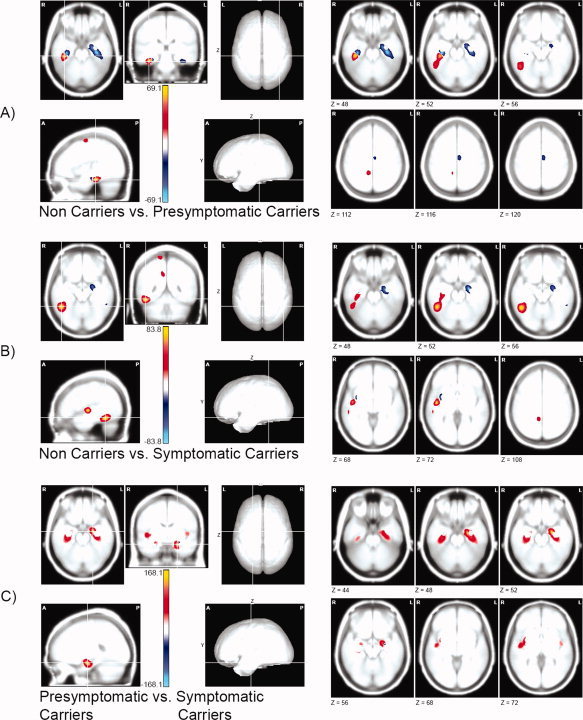
Statistical parametric maps of the difference in cortical current density distribution between groups. The scale represents the Hotelling T2 values (multiplied by the difference between mean modules) for the between groups comparison. Only those voxels where the T2 value reached significance (q = 0.05, FDR corrected) are displayed, with red for positive values and blue for negative values. In the left panel, orthogonal views of the maximum. In the right panel, selected slices displaying principal effects. Z values below each slice indicate the corresponding MNI coordinates. (A) Noncarriers group compared to the presymptomatic carriers group (threshold Hotelling T2 = 21.6, equivalent q = 0.0015). (B) Non‐carriers group compared to the symptomatic carriers group (threshold Hotelling T2 = 21.5, equivalent q = 0.0017). (C) Presymptomatic carriers group compared to the symptomatic carriers group (threshold Hotelling T2 = 20.1, equivalent q = 0.0023). [Color figure can be viewed in the online issue, which is available at www.interscience.wiley.com.]