
Figure 4.
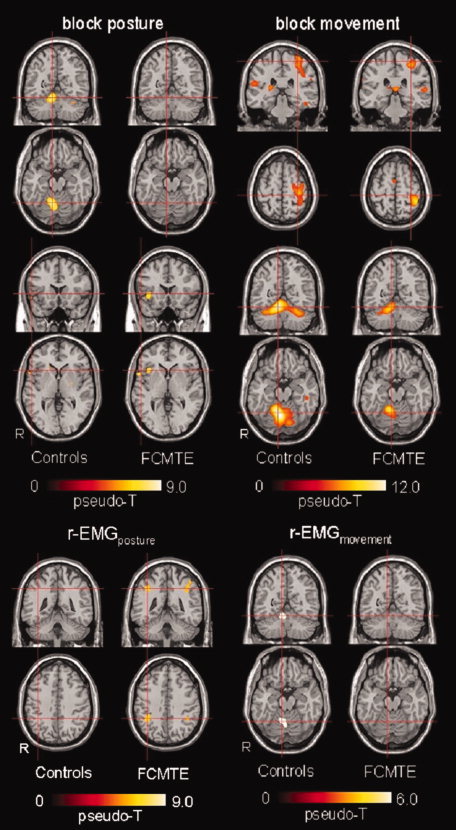
Block versus EMG‐based fMRI analysis, group results. Activation maps per group projected on a normalized single‐participant T1 image. Controls: n = 9; FCMTE: n = 8; n = number of participants. Only main significant activations are illustrated. Upper panel: activations maps resulting from block design regressors. Left: posture. Top: coronal and transverse sections focused at MNI (9,−56,−18), cerebellar hemispheral lobule IV–V; bottom: coronal and transverse sections focused at MNI (52,18,2), frontal inferior gyrus, pars triangularis. Right: movement. Top: coronal and transverse sections focused at MNI (−32,−30,62), postcentral gyrus; bottom: coronal and transverse sections at MNI (9,−56,−18), cerebellar hemispheral lobule IV–V. Only significant activations have been plotted (posture: pseudo‐T > 5.17 for controls and pseudo‐T > 5.69 for FCMTE; movement: pseudo‐T > 5.39 for controls and pseudo‐T > 5.42 for FCMTE). Note the different color scales. Lower panel: Activations maps resulting from r‐EMG regressors. Left: posture. Coronal and transverse sections focused at MNI (38,−44, −41), parietal inferior gyrus. Right: movement. Coronal and transverse sections focused at MNI (9, −56, −18), cerebellar hemispheral lobule IV–V. Only significant activations have been plotted (posture: pseudo‐T > 5.34 for controls and pseudo‐T > 5.61 for FCMTE; movement: pseudo‐T > 5.48 for controls and pseudo‐T > 5.52 for FCMTE). Note the different color scales. See Tables II and III for a complete overview of all significant activations. [Color figure can be viewed in the online issue, which is available at www.interscience.wiley.com.]