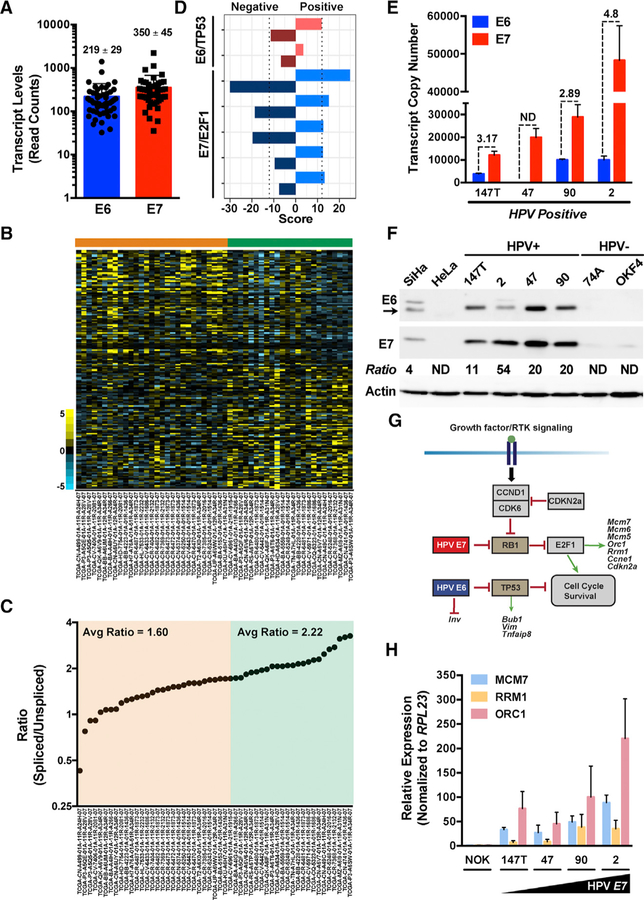
Figure 1. HPV16 E6:E7 Stoichiometry Impacts Gene Expression in HPV(+) HNSCCs.
(A) Raw RNA-seq read counts for full-length, unspliced HPV16 E6 and alternatively spliced E6*I (translated to E7) transcripts.
(B) Heatmap of differentially expressed genes (rows) ordered using the HPV16 E7/E6 ratio as a continuous variable. Samples (columns, n = 53) are arranged according to increasing ratio from left to right.
(C) Spliced to unspliced ratios of HPV16 E7/E6 transcripts plotted against a sorted rank of the ratios from left to right.
(D) Gene set enrichment analysis (GSEA) of E6/TP53 and E7/E2F1 pathway genes. Separate scores were calculated for each pathway listed to identify genes that positively correlate with the E7/E6 ratio versus genes that negatively correlate with the E7/E6 ratio.
(E) Quantitative real-time PCR analysis of HPV16 E6 and E7 transcript copy numbers calculated using respective standard curves established with plasmid DNA encoding E6 and E7. Quantitative real-time PCR was performed using 10 ng of indicated cDNA samples as input (n = 3, mean ± SEM). ND, not detected.
(F) Representative immunoblots of the HPV16 E6 and E7 levels in HPV-positive HNSCC cell lines relative to control HPV16(+) SiHa and HPV18(+) HeLa or HPV(—) HNSCC and normal oral keratinocyte (NOK) cell lines. Densitometry quantification was performed by normalizing the E6 and E7 band intensities to the actin loading control band intensity for each respective sample prior to calculating the E7/E6 ratio.
(G) Schematic of the cell cycle, survival, and differentiation signaling pathways and genes regulated by high-risk HPV16 oncogenes. E6 targets the tumor suppressor TP53, whereas E7 targets the tumor suppressor pRb, relieving E2F1 target gene repression.
(H) Quantitative real-time PCR analysis of select E7/ E2F1 host pathway genes in HPV-positive HNSCC cell lines relative to control HPV(−) NOK cells.
Relative fold expression is shown normalized to RPL23 mRNA levels (n = 3, mean ± SEM). Related to Figures S1 and S2 and Tables S1, S2, and S3.

