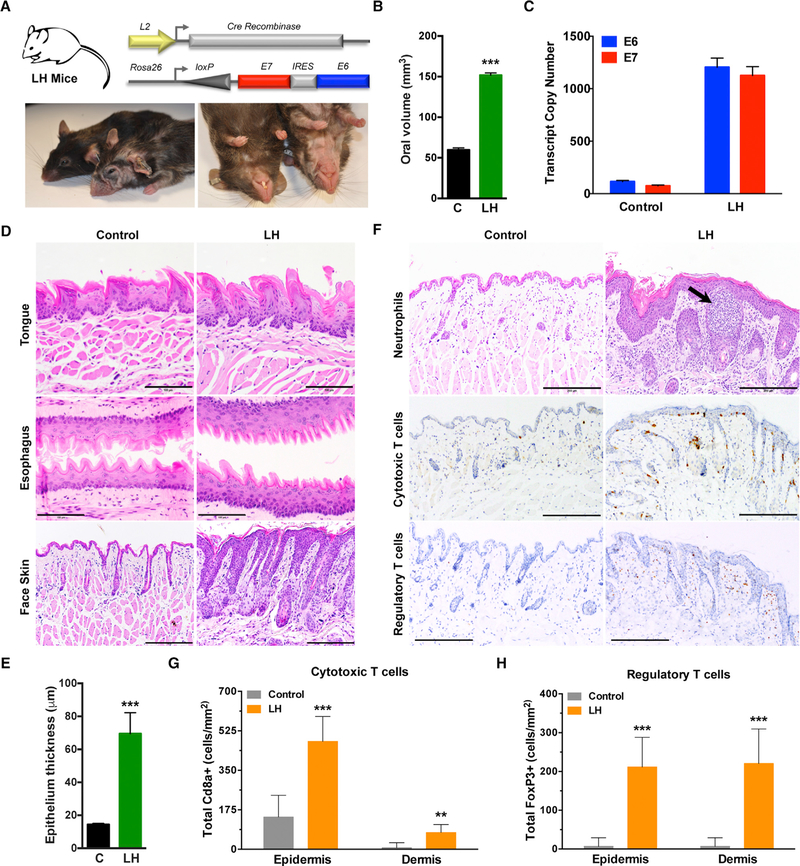
Figure 3. Conditional Oral-Esophageal Expression of E6 and E7 Induces Hyperplasia and Immune Cell Infiltration.
(A) General strategy for generating LH mice by crossing a Cre recombinase strain driven by the Epstein-Barr virus ED-L2 promoter (L) to our knockin HPV16 strain (H; top). Representative photographs of control littermates and the LH animals at 8–10 months (bottom).
(B) Quantification of oral volume calculated based on the formula for an ellipsoid volume less the oral aperture (n = 3, ***p < 0.0001).
(C) Quantitative real-time PCR analysis of E6 and E7 transcript copy numbers from dissected whole tongue of LH and control littermate mice calculated using respective standard curves (n = 3, mean ± SEM).
(D) Histologic analysis of epithelial tissues. Representative sagittal sections from adult tongue, esophagus, and cutaneous epithelia were formalin fixed and embedded, and sections were stained with H&E. Magnification, 200×; bar, 200 µm.
(E) Quantification of cutaneous epithelial thickness calculated in adult LH and control littermate mice (n = 3, ***p < 0.0001).
(F) Histologic and immunohistochemical analysis of immune cell infiltration. Representative sagittal sections from adult cutaneous epithelia were formalin fixed, embedded, and H&E stained (top) and reveal morphologic and histologic abnormalities, such as hyperplasia, dysplasia, and pockets of neutrophil infiltrates. IHC staining is shown for Cd8a+ cytotoxic T cells (middle) and FoxP3+ regulatory T cells (bottom). Magnification, 200×; bar, 200 µm.
(G) Quantification of epidermal versus dermal Cd8a+ cytotoxic T cell infiltration (n = 3, ***p < 0.0001, **p < 0.001).
(H) Quantification of epidermal versus dermal FoxP3+ regulatory T cell infiltration (n = 3, ***p < 0.0001).
Data presented in (B), (E), (G), and (H) are shown as mean ± SEM. Student’s t test (2 tailed) was used to determine significance. Related to Figure S4.

