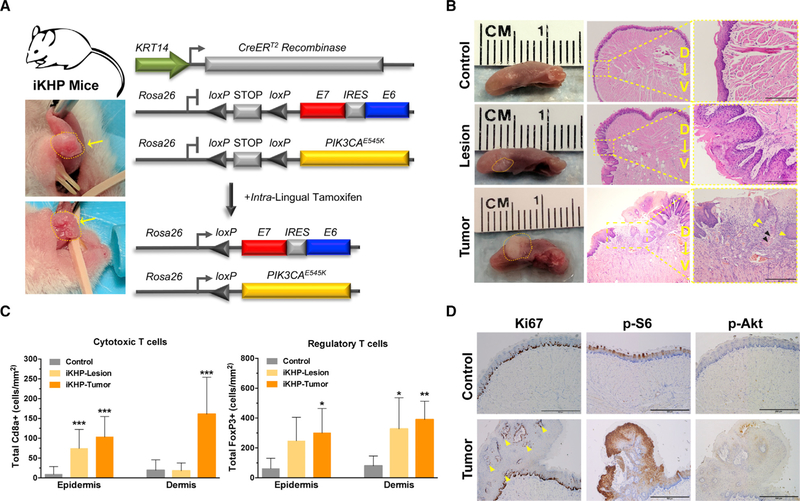
Figure 7. Autochthonous HPV16 E6 and E7 Coupled with PIK3CAE545K Expression Induces Preneoplastic Lesions That Rapidly Progress to Squamous Cell Carcinoma.
(A) General strategy for generating conditional and inducible iKHP mice by crossing the iKH strain to an inducible PIK3CAE545K strain (P). Representative photographs of independent tumors from iKHP animals at 8 weeks.
(B) Mutant PIK3CA cooperates with HPV16 E6 and E7 oncogenes to drive tumorigenesis. Representative images of the gross morphology for control and iKHP tongues at various times post-tamoxifen (left). Representative H&E-stained sections of control tongues compared to iKHP tongues harboring early, pre-malignant lesions (4–6 weeks) or tumors (6–8 weeks; middle). Representative invasive squamous cancer displaying both papillary, exophytic growth, and ulcerative lesion with basement membrane disruption, muscle invasion, and poorly differentiated areas. Tumor inset highlights invasive features (right, 2003) with mitotic figures, nuclear pleomorphism, and hyperchromatism (yellow arrowheads) and keratin pearls (black arrowheads). Magnification (left), 40×; bar, 200 µm.
(C) Quantification of epidermal versus dermal Cd8a+ cytotoxic T cell infiltration (left) or FoxP3+ regulatory T cell infiltration (right) in control versus pre-malignant lesions or frank tumors (n = 3, mean ± SEM; ***p < 0.0001, **p < 0.001, *p < 0.01).
(D) IHC staining of Ki67 demonstrating increased suprabasal proliferation of tumors (left) accompanied by marked increases in p-S6Ser235/236 (middle) staining but not pAKTSer473 (right). Magnification, 200×; bar, 200 µm.
Data presented in (C) is shown as mean ± SEM. Student’s t test (2 tailed) compared to control was used to determine significance. Related to Figure S7.

