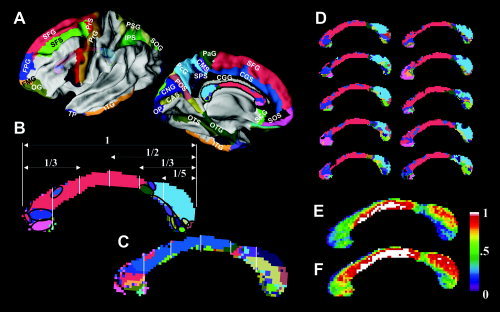
Figure 4.

Dominant connection maps of the CC. The most dominant connection map of the corpus callosum (B) shows the color label distribution of the corresponding cortical lobes (A) that have the maximal interconnection probability through each voxel from all of the cortical subregions. Panel C shows the second most dominant map with cortical lobes that have the second most probable interconnection through each voxel. In panel B, a geometric subdivision method using vertical lines suggested by Witelson [1989] is overlaid with the callosal connection map derived from DT‐MRI. Ten examples of the most dominant individual subject maps are displayed in panel D. Panel E shows the correspondence rate between the 22 individual, most dominant maps and the most dominant map of the group (B). Panel F shows the correspondence rate between 22 individual, most dominant maps and either the most dominant map (B) or the second most dominant map (C).
