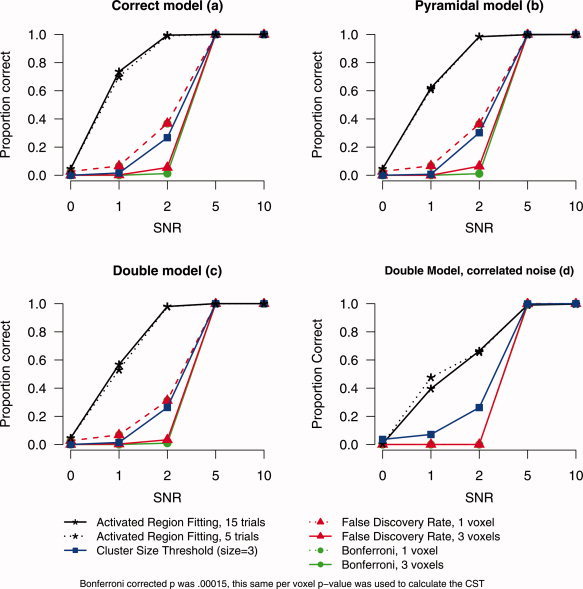
Figure 4.

Proportion correct discoveries (power) for activated region fitting, Cluster size threshold, false discovery rate, and Bonferroni as a function of signal‐to‐noise ratio for three shape models [correct (a), pyramidal (b), and double (c)]. (a–c) The uncorrelated noise data. (d) The correlated noise data with the double model. [Color figure can be viewed in the online issue, which is available at www.interscience.wiley.com.]
