
Figure 3.
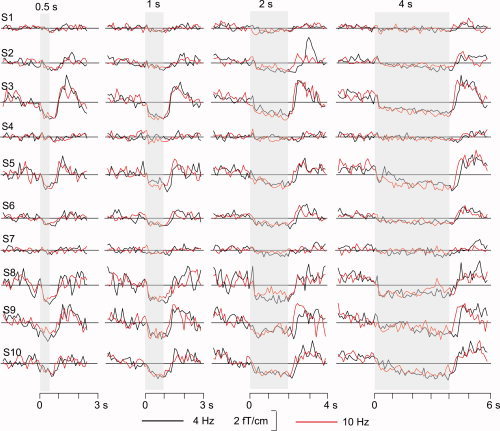
Envelopes of the 17–23 Hz signals at the representative left hemisphere channels used for model estimation. Data from all 10 subjects (S1–S10), for both stimulus presentation rates (4 Hz and 10 Hz) and all four stimulus durations (0.5, 1, 2, and 4 s) are shown.