
Figure 7.
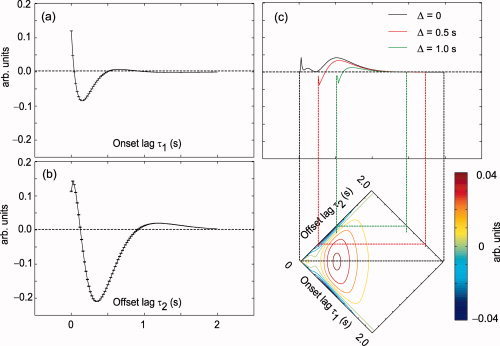
Onset (a), offset (b), and interaction (c) kernels of the bivariate nonlinear model. The kernels were computed from the mean set of parameters across subjects and conditions. Slices of the interaction kernel parallel to the diagonal represent the nonlinear component of the predicted response, at respective time separations between onset and offset i.e. stimulus durations. Slices corresponding to durations 0, 0.5, and 1.0 s are shown.