
Figure 8.
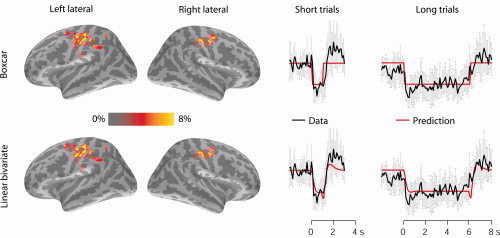
Predictions of spatial generators of the 20‐Hz rhythm, and the corresponding time courses. Left: The mean modulation depth maps (MDMs) across subjects, resulting from a general linear model (GLM) of the cortical current envelopes, with the boxcar, and the linear bivariate model separately used as regressors. All MDMs were projected on an inflated Free Surfer Average (FSA) brain. The colored regions represent the source points with top 1% modulation depth. Right: The mean envelopes of the cortical minimum‐norm estimates for the source point with maximum MD, further averaged across the test subjects for both short (1‐s) and long (6‐s) stimulus blocks. Predictions of the envelope by the stimulus time course (top) and the linear bivariate model (bottom), are overlaid on the envelopes. The models were derived from the training data. The error bars show standard errors of mean (N = 5 subjects).