
Figure 4.
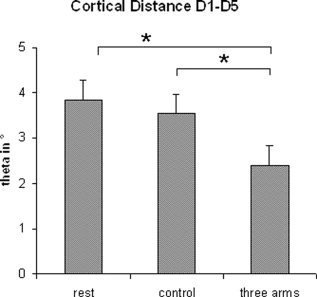
Mean differences and standard errors for the cortical distances between the cortical representations of D1 (various conditions) and D5 (rest state) in polar angle Δϑ (group data). Note the differences between the illusion condition (three arms) and rest state or control, pointing to a shift of the cortical representation of D1 to a more medial and superior position.