
Figure 2.
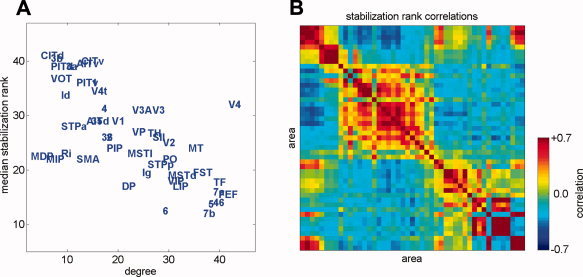
(A) Scatterplot of median stabilization rank against degree (sum of in‐ and out‐degrees). (B) A map of the correlations in stabilization rank across runs, with areas arranged in the same ordering as in Figure 1A. Warmer values indicate that a region pair will have correlated stabilization ranks; cooler values indicate that regions will have anti‐correlated stabilization ranks. There is significant agreement of these stabilization rank correlations with either TE patterns or BOLD cross‐correlations obtained from a previous model of macaque cortex [Honey et al., 2007].