
Figure 2.
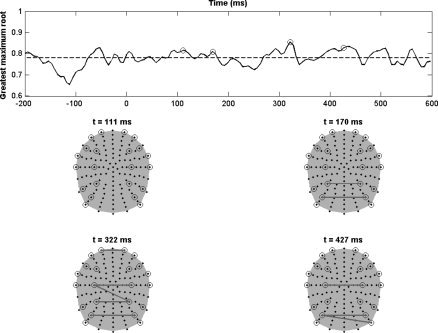
(a) Top: Greatest root statistics and decision threshold for an inter‐hemispheric comparison at significance level P = 0.05. (b) Bottom: Topographic maps of the correlation analysis at four different time instants of local maximum greatest maximum root statistics (marked with circle in the top plot). [Color figure can be viewed in the online issue, which is available at www.interscience.wiley.com.]