
Figure 3.
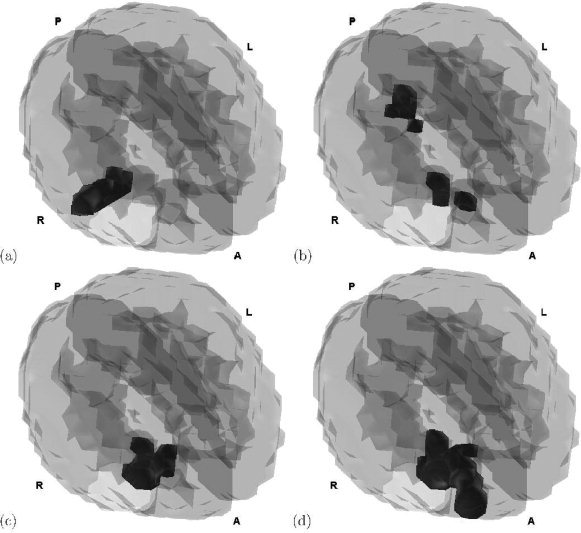
Tomographic maps of the homologous correlation analysis between the sources generated by the left and right scalp channels at times t = (a) 111 ms, (b) 170 ms, (c) 322 ms, (d) 427 ms. Letters A, P, L, R in each subplot mean anterior, posterior, left and right, respectively. We conclude that there are statistically significant homologous correlations mainly in the right fronto‐temporal region. [Color figure can be viewed in the online issue, which is available at www.interscience.wiley.com.]