
Figure 11.
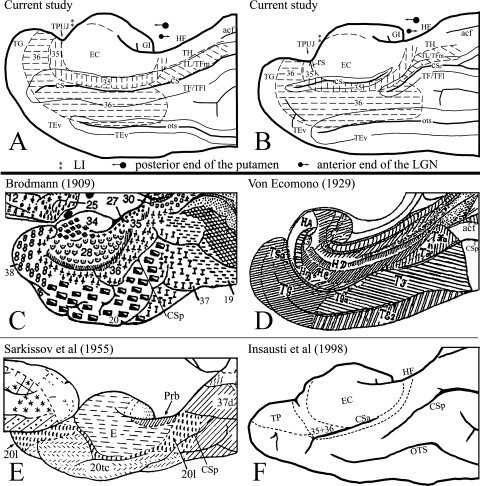
Summary of the present mapping of human areas 35 and 36 (A, B) and comparison with previous mappings (C–F). (A, B) Medial aspect views of human MTL show the locations and topography of areas 35 and 36 and adjoining regions (outlined by dashed lines) in the brains with type‐I CS (deep CS, A) and type‐II CS (shallow CS, B). The CS and OTS were opened up (outlined by fine continuous lines) for easy viewing of the areas in the sulci. The locations of some critical landmarks for border definition were also labeled. For detailed explanation, see text. (C–F) Medial aspect views of human MTL from previous maps were shown for comparison with the current maps. (C) Map of Brodmann [1909]; (D) map of von Economo [1929]; (E) map of Sarkissov et al. [1955]; (F) map of Insausti et al. [1998b]. Note the CSp is indicated in each map for reference and comparison.